Is the Indian Economy Perfectly Balanced?
“Goldilocks” Claim
-
Government view: India is in a rare “Goldilocks” phase → moderate growth (7.6% GDP), subdued inflation, stable monetary policy.
-
Critique: Headline stability hides structural imbalances and uneven benefits.
-
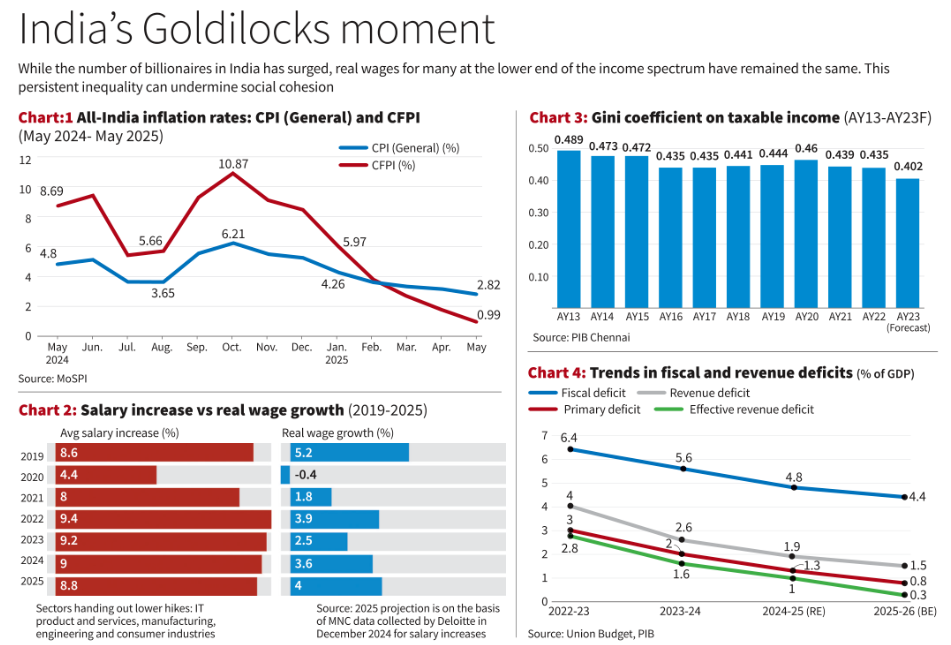
CPI fell from 4.8% (May 2024) → 2.82% (May 2025).
-
Food inflation (CFPI) often much higher than general CPI:
-
Oct 2024: CPI 6.21% vs CFPI 10.87%.
-
-
Food = ~50% of poor households’ budget → high volatility driven by factors like unseasonal rains, supply chain disruptions and global commodity price fluctuations, severely erodes the purchasing power of the common citizen.
Economists argue that policymakers such as the RBI should focus on core inflation rather than headline CPI inflation, because core inflation excludes volatile food and fuel prices and better reflects the sustained burden of price increases across essentials like housing, education, transport, and personal care.
-
Real wage growth often far lower than nominal hikes:
-
2023: Nominal +9.2%, Real +2.5%.
-
2020: Nominal +4.4%, Real −0.4%.
-
-
Inflation quietly eats into pay raises results in “silent squeeze” on savings, spending.
-
Gini coefficient (taxable income) fell from 0.489 (AY13) → 0.402 (AY23), but:
-
Captures only formal sector.
-
Informal sector & wealth inequality remain unaccounted.
- The Gini coefficient is a statistical measure that represents the income or wealth distribution within a population. It ranges from 0 to 1, where 0 indicates perfect equality (everyone has the same income/wealth) and 1 represents perfect inequality (one person possesses all the income/wealth).
- The Gini coefficient is derived from the Lorenz curve, which plots the cumulative share of income (or wealth) against the cumulative share of the population.
- A higher Gini coefficient indicates greater inequality, while a lower coefficient suggests more equal distribution
-
Recent K-shaped recovery after covid: affluent sectors thrive, others stagnate.
-
Billionaires rising, but wages stagnant for lower-income groups → risks to social cohesion & inclusive growth.
-
Fiscal deficit: 6.4% (2022–23) → 4.4% (2025–26 BE).
-
High public debt (~81% of GDP) limits fiscal space.
the revenue deficit decreasing from 4% to 1.5%
The primary deficit, which indicates the current year’s borrowing excluding interest payments on past debt, is also projected to fall from 3% to 0.8%.
However, for a developing economy like India, sustained high deficits can pose several macroeconomic challenges.
-
Concerns of sustained high deficits
-
Crowding out private investment.
-
Reduced social sector spending.
-
Future tax burden for citizens.
-
-
Macro “sweet spot” doesnot potray the everyday reality.
-
Structural issues:
-
Volatile food prices
-
Stagnant real wages
-
Unequal distribution of gains
-
Tight fiscal space
-
-
True balance means inclusive growth, rising real incomes, and fiscal resilience not just good GDP and CPI numbers.
India’s economy may look “just right” on paper, but for many households, it still feels unbalanced and fragile.